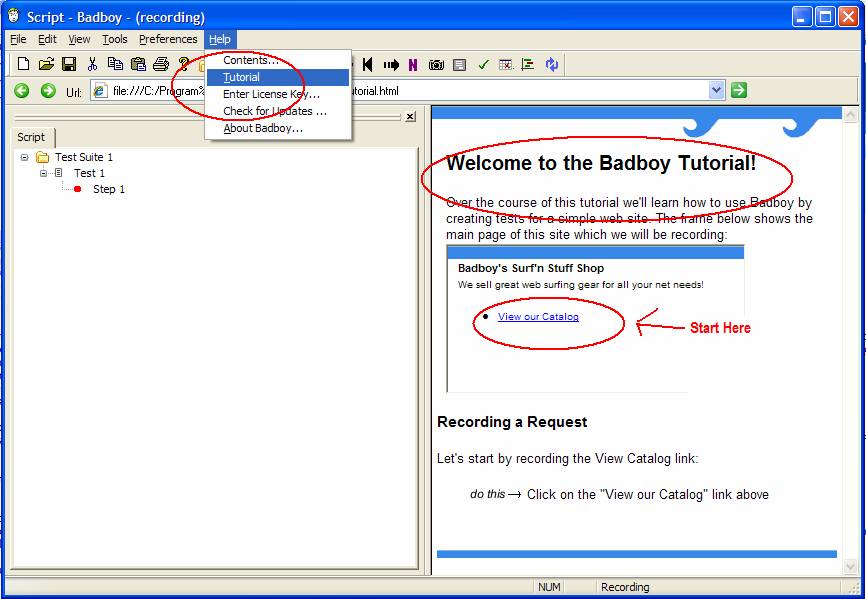
A good starting point is Badboy’s tutorial:
Badboy’s Strong Points
Badboy does generate load against ASP.Net web sites. It is the only inexpensive tool I know of besides VSTS which can handle ASP.Net Viewstate and other parameters. Web Application Stress Tool will choke on the viewstate problem.
As with all load testing tools, there are 3 steps to actually getting a load test running with Badboy:
I. Recording your script.
II. Parametrizing your script with a lot of users and their associated user information, and setting think times in the script.
III. Running the script with all your users, and gathering and analyzing the results, hopefully in a graph format.
Experienced load testers will recognize these steps from other load testing tools such as LoadRunner, but they are poorly documented in the BB help.
Badboy’s Weak Points
BB is not a substitute for LoadRunner. It is better suited at this point in its development for use by individual developers to test the individual page he is working on.
- There’s no ability to hook LoadGenerators together.
- BB's reporting capabilities are miniscule in comparsison to LR, therefore not really suitable to report to management.
BB cannot report on or record it's client-side response times for every request during a load test. The most promising possibilities as I can find in the help in regard to this:
1) Using a Javascript
2) using "Save Item" tool element
3) Setting the log to "debug"
4) Right click on the threads and choose save
I have investigated all of these and I have not been able to make any of them work. I think this gets back to the issue that Badboy
From a logical ping of view, we can see that BB somehow gets the Max, Min and average response times in the end of the test. It must be storing data about these response times someplace. If we could access that data, we would have what we want. However, I can’t figure out how BB it stores it's datapoints.
Therefore, BB has some significant reporting limitations. .
I think the makers of Badboy think of the tool more as a unit testing tool, and have thrown in Load testing as an added feature. It works, but they haven’t quite got all the controls and documentation laid out for it to be really intuitive to use. Correct set up of a load test is in fact counter-intuitive. To the way their controls are laid out and contradicts some of the documentation in version 2.0.
Set up of Badboy
Preliminaries
1. The help that ships with BB is nearly useless for getting started.
2. The online forum is pretty good. Read the online forum: http://www.badboy.com.au/forum/viewtopic.php?t=1163&highlight=thread
3. The tutorial is worthwhile however, and you should do it. It takes 5 minutes.
Badboy must be setup to capture ViewState and other parameters correctly.
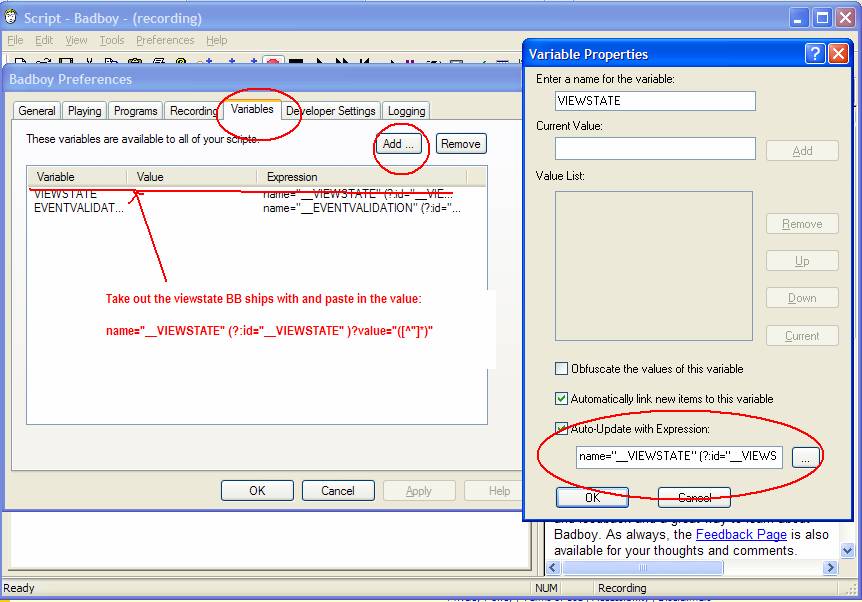
Step one: Go to Preferences

Go to the Variables tab of the Preferences dialog and click “Add”.
Delete the viewstate that BB ships with and add a new regex for the viewstate.
This is per the article in the BB forum here:
http://www.badboy.com.au/forum/viewtopic.php?t=899&highlight=syntax+xhtml+source - Tue Jun 13, 2006 6:21 pm
There is also an article in the forum on view state here:
http://www.badboy.com.au/forum/viewtopic.php?t=266&highlight=name+viewstate++viewstate+value - Posted: Mon Jan 03, 2005 1:22 am
Preliminary Tips:
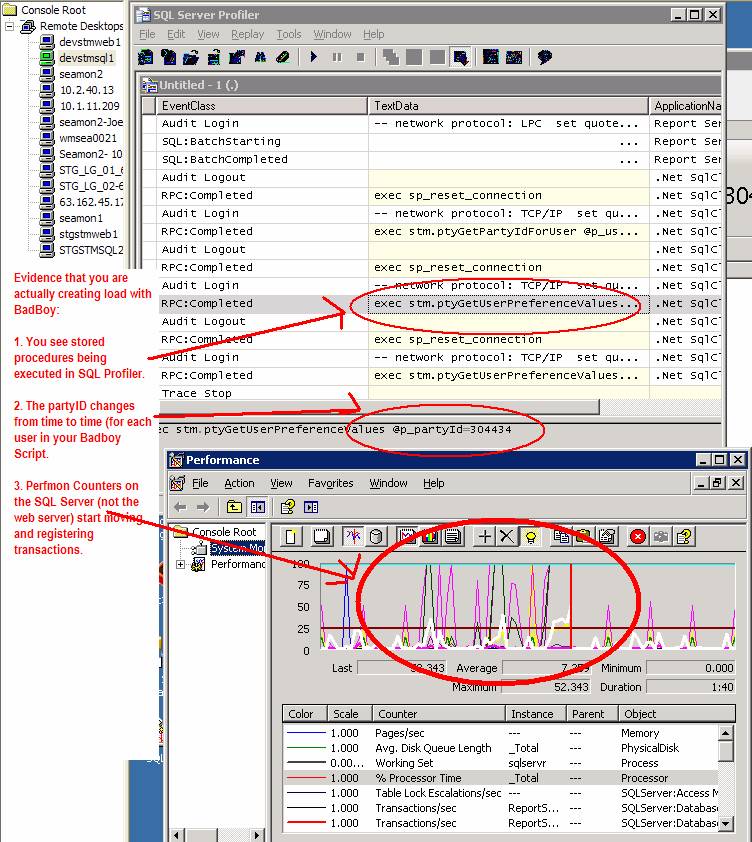
- You really need to execute all preliminary/trial runs of a load test with SQL Profiler up and running. This is to determine if you are actually generating real load. If you don’t see stored procedures being executed, and you feel like you should, and you have followed all the steps below, or you know the script worked yesterday, exit Badboy, kill all the processes and restart it again.
- Bad boy has a pretty good “Undo” command under the Edit menu. You might want to make use of it.
- Until you have finished creating your script per this document, Badboy will run very badly or not at all. For one thing, the parameters which work with Badboy’s “thread” mode are completely different than the parameters that worked with Badboy’s non-threaded mode (i.e., you must put the word “thread” in the parmeters after moving to thread mode.) So until you complete setting up the threads, nothing will really run.
- Badboy has a bad bug in it especially when you get to actually running load tests and are involved in threading. This bug does not occur with the unit testing mode. The bug is that the command thread do not shut down. See the screen shot at the end of this tutorial. You have to go in and kill these extra processes inbetwen you test runs and also while you are developing a script.
- ALWAYS save your BB script before running. BB does not necessarily resave the script before a run.
- If you setup the threading incorrectly, you will crash the machine you are running BB from. You may want to use a second test machine. There is a step which is completely opposite of what you must do to run BB in a non-threaded mode. If you miss this step you create a huge number of bad processes and you will crash your machine.
- When recording In order to start a new browser instance of BB, you must shut down BB.
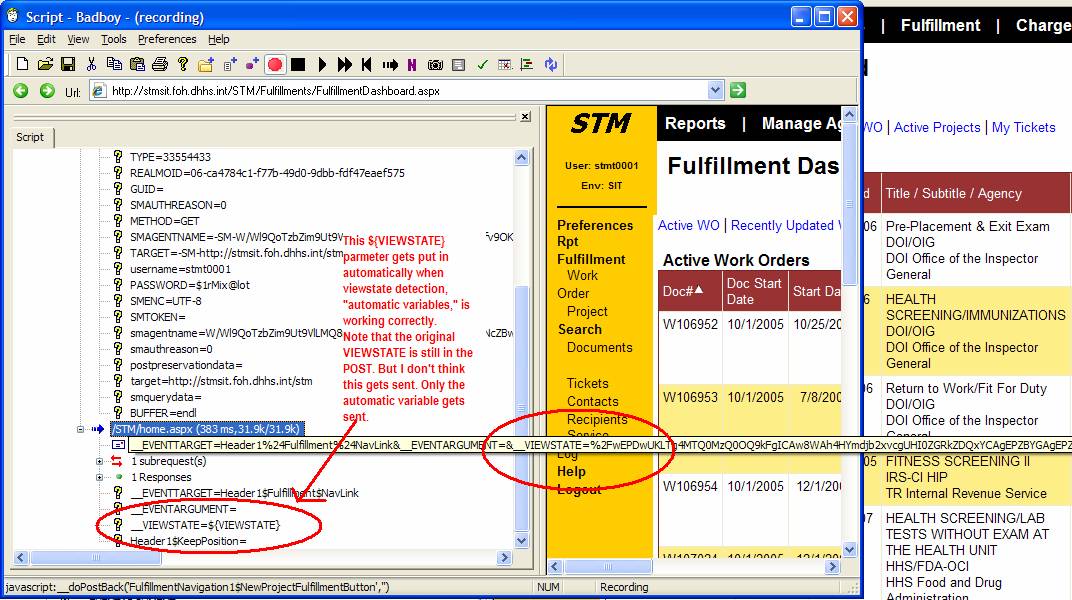
- Use the search and replace feature to change all your viewstate variables and username variables to threaded variables eg. ${VIEWSTATE[{threadNum}]}
I. Recording your script (Creating a script with multiple users. )
Since our STM application requires users to log on and uses their paramters through out, we need a bunch of users in order to do a load test against STM. Badboy likes to have these users in and Excel spread sheet.
Open Excel and make a spreadsheet that has two columns, with the names of your two variables (username and password) at the top of the column (these column names are case sensitive and must match the case in the Badboy script). Add the values for user name / password into each column. Save the Excel spreadsheet as a *.xls file
· Start up Badboy. Badboy starts up in record mode. So just type in the URL you want to hit and then press Enter.
- After you hit enter, for the submit of the login credentials, hold down Ctrl+Alt so that you record it in "Navigation Mode".
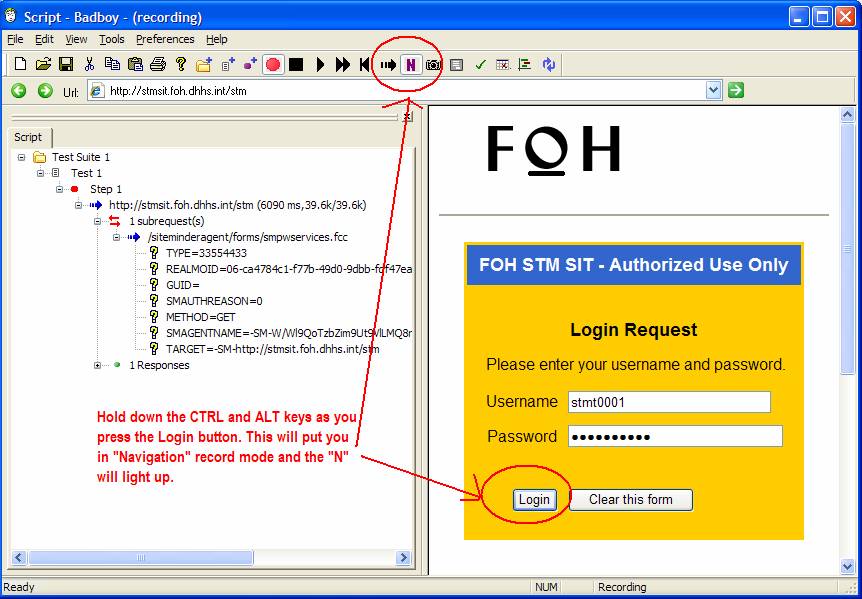
- You should have a Form Populator recorded - expand it and find the user name and password fields that should be in there.
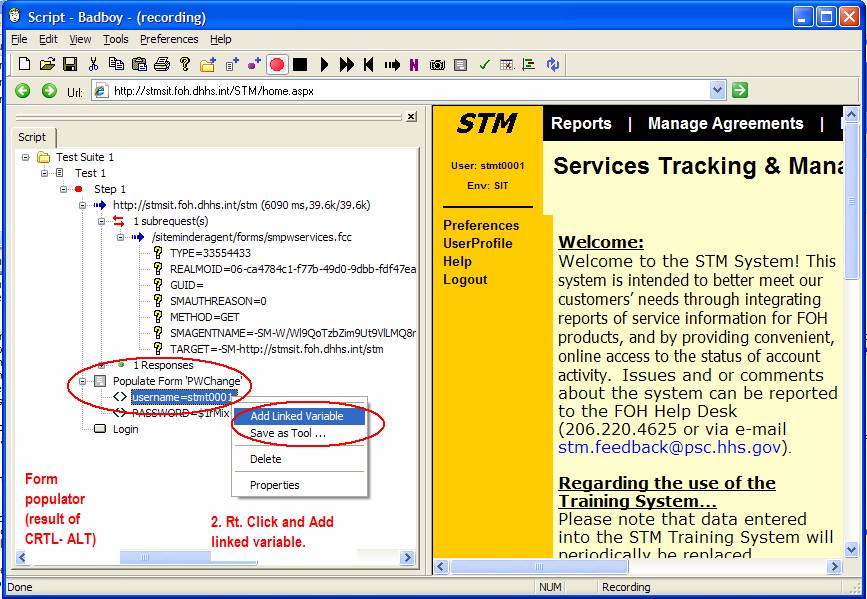
- Right click on the user name form value and select "Add linked variable." When the linked variable dialogue pops up, just click “OK.” You don’t need to enter any information in this dialog. Note that the variable changes to ${username}.
- Do the same for the password field , if you users have different passwords.
- Open the "Variables" view (Ctrl+Alt+V should bring it up) - you should have your two variables there.
- Back in your Badboy script, open the Toolbox (Ctrl+T) and drag a Data Source Item into your script - drop it just above (before) the Step that you recorded in.
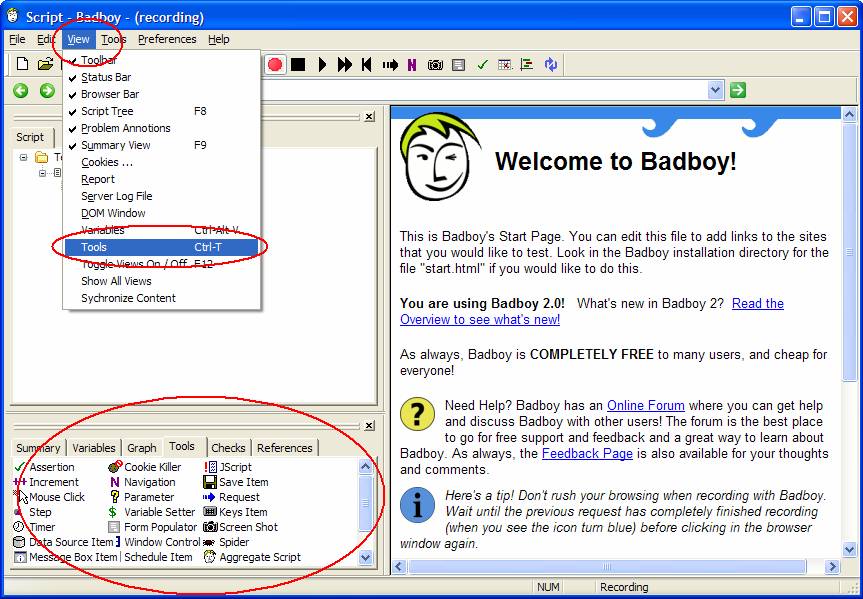
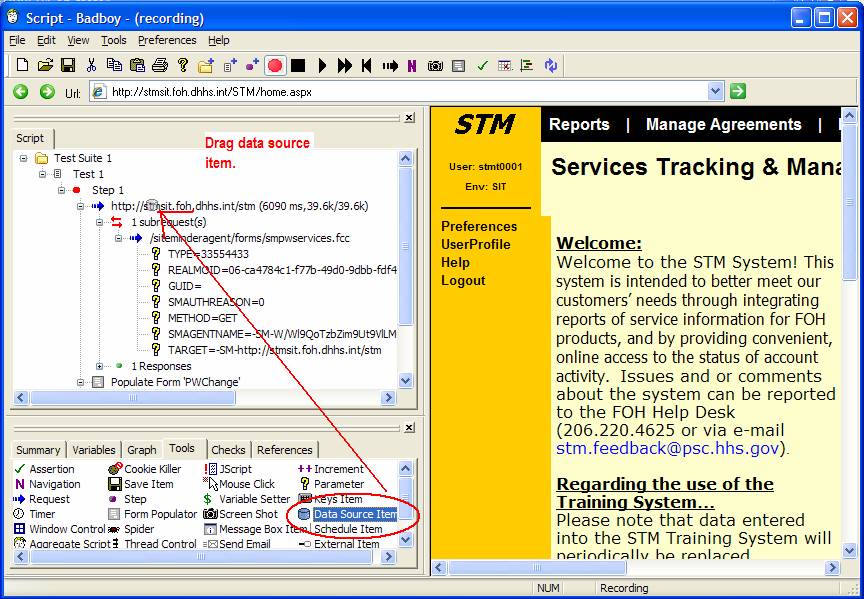
- Select "Excel Files" from the list of Data Sources offered.
- Select your spreadsheet from the next dialog that is offered
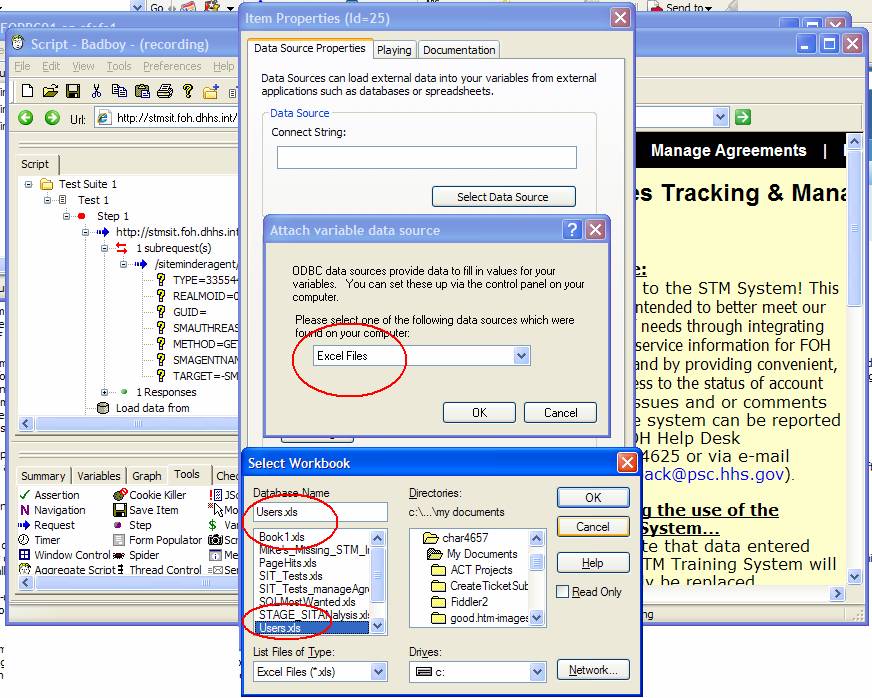
- Click OK to close the data source dialog
- Choose “Sheet1$” from the “Select a table dialogue. Hit OK again. Now Right Click on your Step and select "Properties", and select "For each value of Variable" in the "Repeat" section, and select the "Username" field as the repeat variable.
- Notice that your username is now converted to a variable. All BB variables have the “$” in front of them. E.g. ${username}
Note: Be sure that the datasource is ABOVE the step. You don’t want to re-load the datasource on every thread or every repetition of the step. You just want it to load once, then the iteration or repletion of the step begins. If you get it in the wrong place, you can just drag it to above the step.
Now we come to 4 poorly documented steps. In fact, they are the opposite of what some of the documentation says about creating non-threaded tests.
1. Convert the step to run as a thread.
2. Changing the parameter to a thread parameter
3. Changing the run from “Raw” to MSHTML
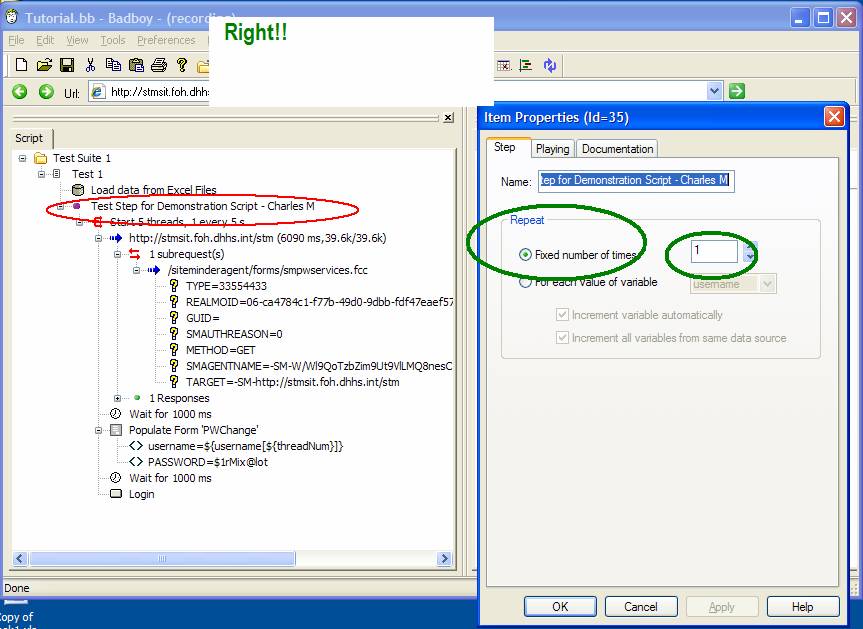
4. Set the Playing Properties of the Step to “Fixed Number of Times” (not per user).
Converting a Step To Run As A Thread
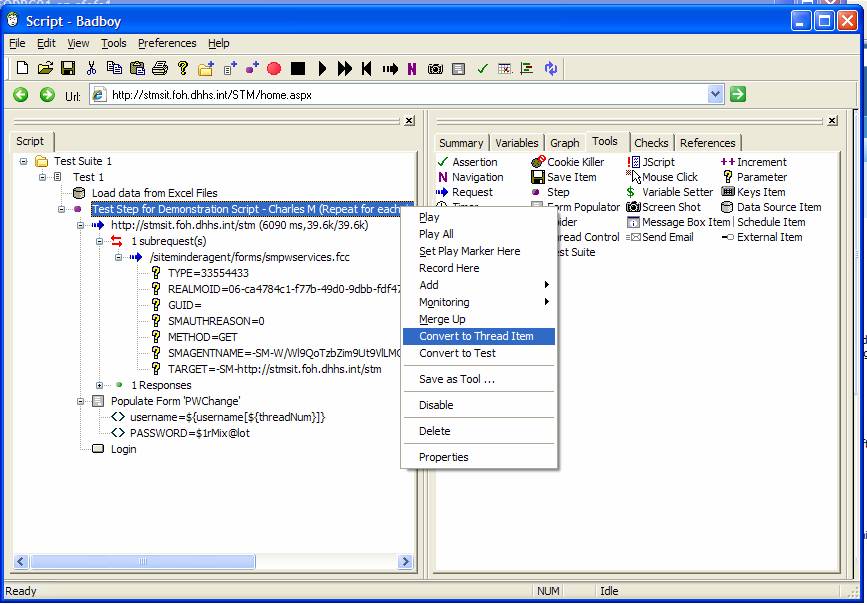
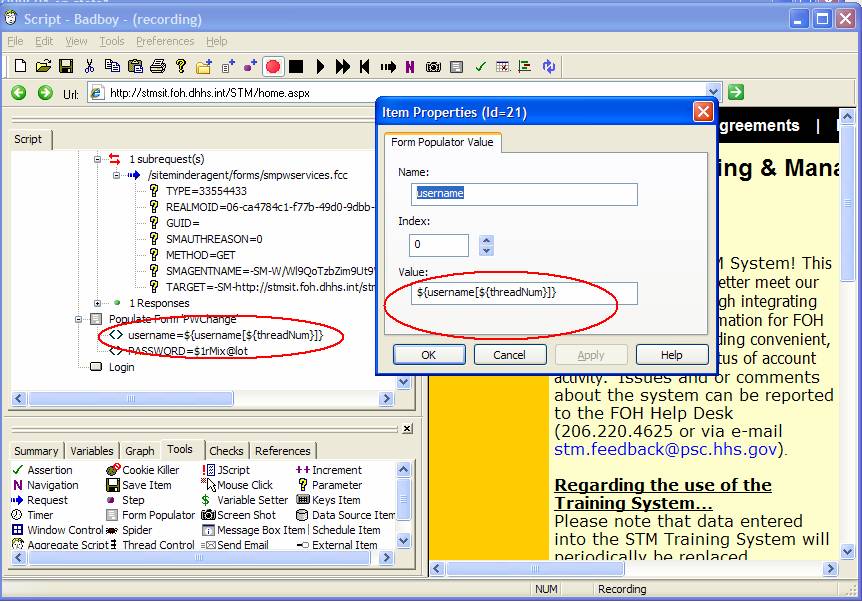
IMPT undocumented step #2! Changing All Parameters (including viewstate!) To Thread Parameters.Once the step has been converted to a thread, you have to change any parameters you have created. You must put [${threadNum}} after the parameters. Like this:
String to parameterize username:
${username[${threadNum}]} ß-- NOTE! Be sure there are NO SPACES!!!! When you paste this in!!!!!!!!
${username[${threadNum}]}
${VIEWSTATE[{threadNum}]}
Rt. Click on each parameter you have created.
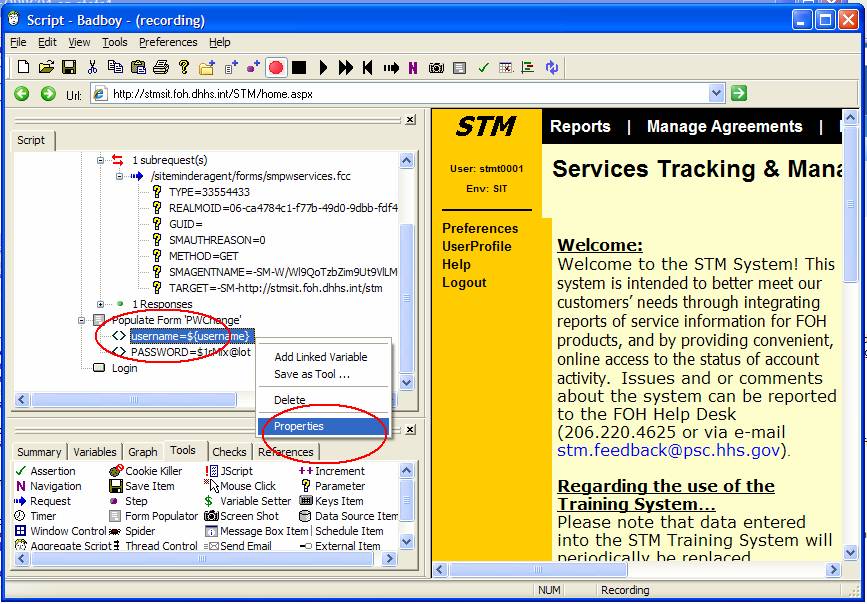
Copy and paste this into ${username[${threadNum}]} the properties
${VIEWSTATE[{threadNum}]}
Finished Param
Poorly documented Step #3:Changing the run from “Raw” to External MSHTML. Right click on the Step you just converted to a thread item, and set the properties to use ExternalMSHTML or MSHTML. Raw will not work on the STM application. The documentation states that this is because we usef the form populator control in order to navigate through the logon. I.e., when we used that form populator, we stepped outside of “raw” mode. Yet it seems like to use any logon form, Badboy must step outside raw mode. So we are stuck here.
MSHTML and External MSHTML, in contrast to “Raw” actually do some parsing of the HTML (like LoadRunner), whereas the “raw” mode is more like Web Application Stress tool. It might be possible to figure out how to do a log on with raw mode, by parameterizing the request itself, but I have not figured out how to do this, especially after the item is converted to a thread. The disadvantages of the “Parsing” modes of Badboy vs. the raw mode is that the Parsing modes use a lot more processor and memory on your load generator. But if you have set think time appropriately, I don’t think that using the External or MSHMTL modes will be a problem. If your forget to set think time your are probably going to crash your load generator.
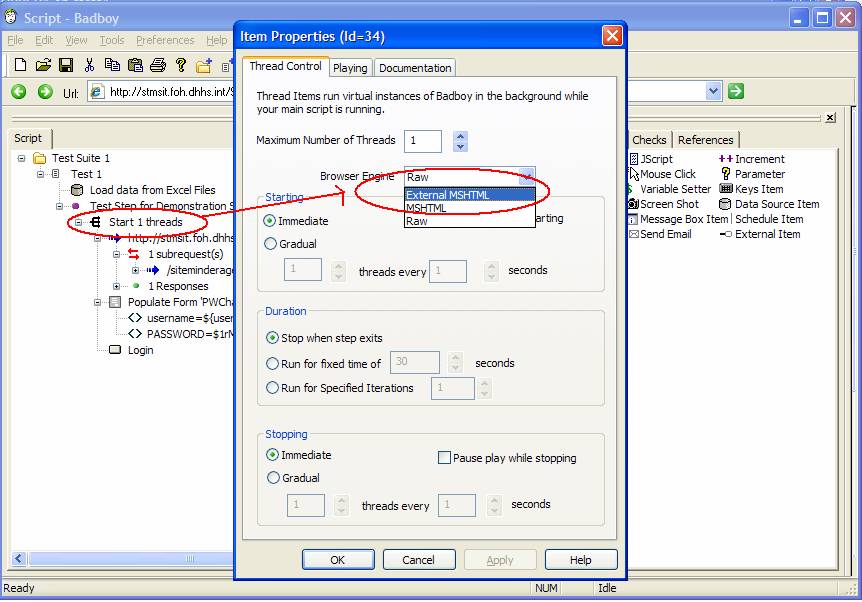
Also at this time you can change the other settings in the Thread Item Properties dialog
- Maximum Number of threads to 10 (for the SIT environment)
- Make sure Starting is set to “Gradual” radio button.
- Start 1 thread every 5 seconds.
- Run for a fixed duration of 30 minutes (you can stop the test before this)
Poorly Documented Step #4: Set the Playing Properties of the Step to “Fixed Number of Times” the You would think intuitively that you want to increment the user each time the step is iterated. However, this will result in potentially hundreds of threads running on your machine. This is not what you want. You really want each user (thread) to pick up his own user name and credentials.
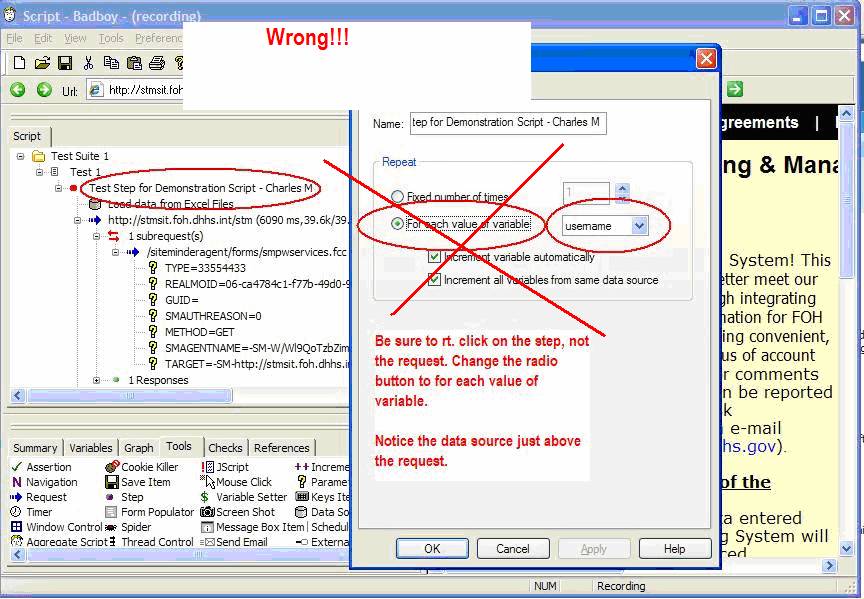
This is counter intuitive and somewhat contrary to documentation.
B. Setting “Think Times” (Timers)
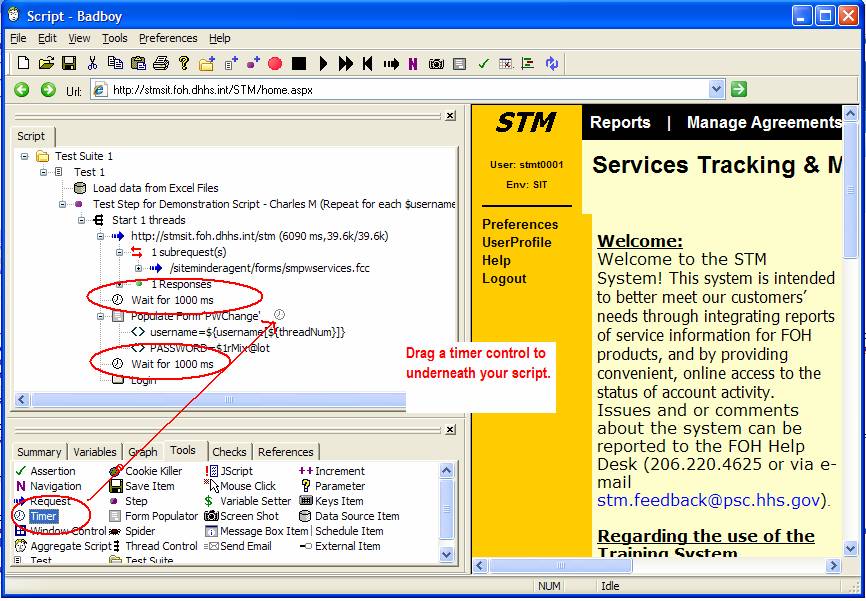
You really must set think times between the steps of your script. Badboy does not make this obvious. But if you don’t you will overload the web server you are testing and get all sorts of timeouts.
To set think times, open the toolbox again and drag a “timer” control underneath your request. A dialog box will automatically pop up. You can set them to realistic think times, or leave them at the default of 1000 milliseconds. If you are planning to run a load test with a lot of users, you MUST set realistic think times. This is because Badboy only allows one load generator (your local machine). If you don’t set some good think times of 5 and 6 seconds, you are going to run out of processor and memory on you local machine.
Checking Your Work at this Point
At this point you might want to check your work to verify that you are creating something which is
a) Actually going to stress STM
b) Stresses STM with different users.
Note: If you only log in and you only go to the home page, you will NOT hit the STM database. You must navigate to a second page, such as the Fulfillment dashboard.
Evidence of a good script is found by opening Profiler on the SQL
I have saved a copy of the logon script to:
\\seafs1\Projects\STM\Test\Load Tests\Tools\BadBoy\Templates\WorkingLogOnScript_StartingPoint.bb
To use this as a template
a) begin recording at the bottom of the script
b) You will have to re-record the log on, but then you delete that section of the script.
c) Step through the script by right clicking on each request and pressing Play until you get to the bottom of the script. Then press the red record button.
Check through your script to make sure all viewstates have been parametrized. This should happen automatically, but might not.
Make sure all username variables have been converted to thread items.
Reporting
A. Badboy Built in Reports
- One Hit (no load) Response times
Badboy can give you a page breakdown of each individual page. This is NOT under load however; it is the page load time one user doing one hit. You could, of course, run BB on a second machine. The first machine would run BB as a load tool, and then on the second machine run this report on individual pages. This would give you some idea of how the page behaves under load.
To get this report you step through your script one request at a time (by right-clicking on each request and choosing “Play”) and then clicking the little button which looks like a horizontal bar graph -- “view timing report” is the tool tip.
Clicking the Graph
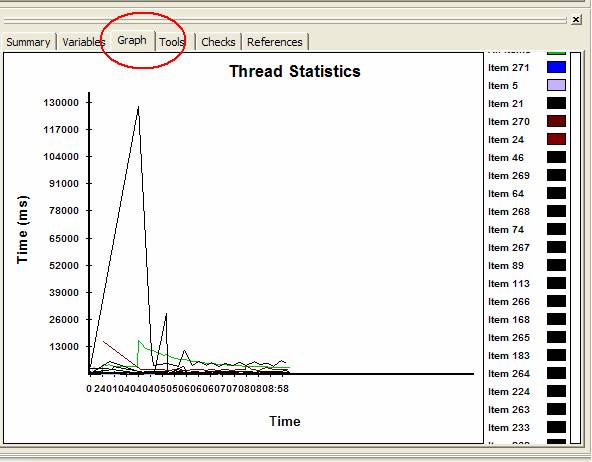
Badboy 2.01 has response time graph. But it is not very good.
Badboy Response Time Graph
2. Getting other web and SQL metrics
I think the best way to report is with Perfmon and Excel.
You can ultimately make a template in Excel which will automatically create graphs for you once you paste the data in.
Put the following in a file called “Counters.txt” Put this file in C:\perflogs.
\\DEVSQL1\LogicalDisk(E:)\% Disk Time
\\DEVSSQL1\LogicalDisk(E:)\% Disk Write Time
\\DEVSSQL1\LogicalDisk(E:)\Avg. Disk Bytes/Read
\\DEVSQL1\LogicalDisk(E:)\Avg. Disk Bytes/Transfer
\\DEVSQL1\LogicalDisk(E:)\Avg. Disk Bytes/Write
\\DEVSQL1\LogicalDisk(E:)\Avg. Disk Queue Length
\\DEVSQL1\LogicalDisk(E:)\Avg. Disk Read Queue Length
\\DEVSQL1\LogicalDisk(E:)\Avg. Disk sec/Read
\\DEVSQL1\LogicalDisk(E:)\Avg. Disk Write Queue Length
\\DEVSQL1\LogicalDisk(E:)\Current Disk Queue Length
\\DEVSQL1\Processor(_Total)\% Processor Time
\\DEVSQL1\SQLServer:Access Methods\Full Scans/sec
\\DEVSQL1\SQLServer:Databases(STM)\Transactions/sec
\\DEVSQL1\SQLServer:Databases(tempdb)\Transactions/sec
\\DEVSQL1\SQLServer:SQL Statistics\Batch Requests/sec
\\DEVSQL1\SQLServer:SQL Statistics\SQL Compilations/sec
\\DEVWEB1\.NET CLR Exceptions(_Global_)\# of Exceps Thrown / sec
\\DEVSWEB1\ASP.NET Apps v2.0.50727(__Total__)\Requests/Sec
\\DEVWEB1\Memory\Available KBytes
\\DEVSTMWEB1\Processor(_Total)\% Processor Time
\\DEVWEB1\Web Service(_Total)\Get Requests/sec
\\DEVWEB1\Web Service(_Total)\Post Requests/sec
Start a command prompt.
Type at the command prompt:
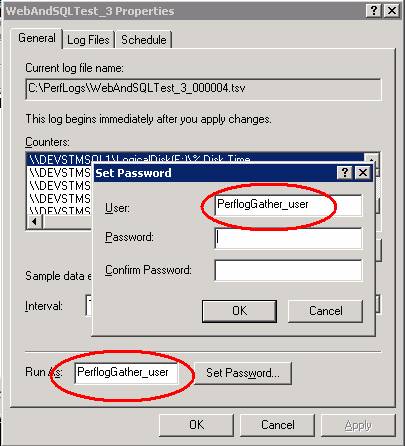
logman create counter WebAndSQLTest_4 -f csv -si 5 -cf "c:\perflogs\Counters.txt" -u PerflogGather_user *
Set Perfmon Counters to a collection interval of one. You may need to set this to a smaller interval for longer tests in order to prevent the log from growing to large to import into Excel.
I have found, too, that a lot of problems with gathering counters are solved if you create a local user on each machine (by passing domain authentication), and run the perflog as this user.

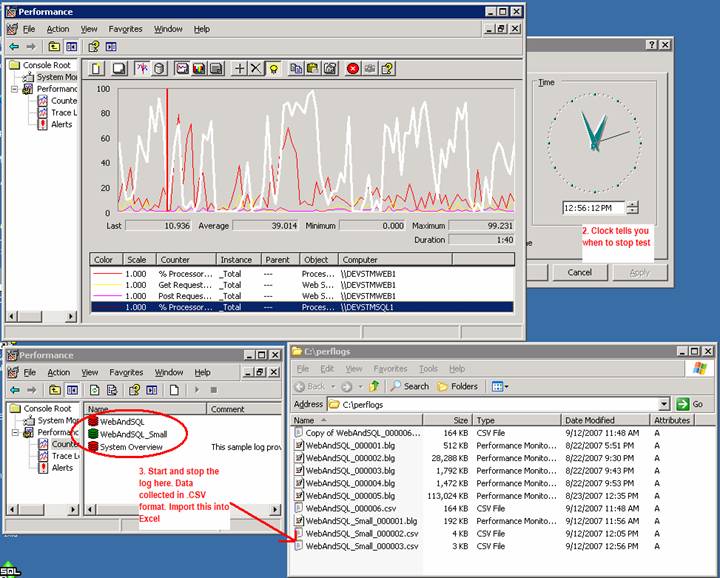
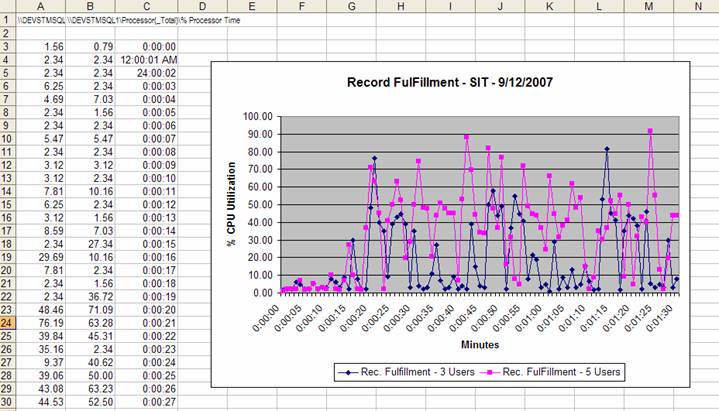
You can read in the Perfmon Data in Excel and make graphs in Excel. However, at the Dev level a lot of the perf improvement can be determined simply by eye-balling the perfmon counters as you are running the bad boy test.

C:\WINDOWS\system32\LogFiles
Install Log Parser http://www.microsoft.com/downloads/details.aspx?FamilyID=890CD06B-ABF8-4C25-91B2-F8D975CF8C07&displaylang=en
Create a .sql file called “countpages.sql” and put the following things in it:
SELECT
--COUNT(cs-uri-stem),
cs-method,
cs-uri-stem as URI,
--sc-win32-status,
time-taken
FROM C:\WINDOWS\system32\LogFiles\w3svc1\*.log
where URI like '%FulfillmentDashboard.aspx%'
--group by cs-uri-stem, cs-method, sc-win32-status
order by time-taken desc
--order by cs-uri-stem
You can put a where clause in to look at just the aspx you are working on. E.g.
Run this command against the log file.
LogParser.exe -i:IISW3C file:countpages.sql –q
Results:
POST /STM/Fulfillments/FulfillmentDashboard.aspx 2203
POST /STM/Fulfillments/FulfillmentDashboard.aspx 2187
GET /STM/Fulfillments/FulfillmentDashboard.aspx 2187
POST /STM/Fulfillments/FulfillmentDashboard.aspx 2187
GET /STM/Fulfillments/FulfillmentDashboard.aspx 2156
GET /STM/Fulfillments/FulfillmentDashboard.aspx 2156
GET /STM/Fulfillments/FulfillmentDashboard.aspx 2156
I'm not familiar with that function in QTP, but there are a few things you can do in Badboy to report events from JScript. The simplest is to put a JScript item from the Toolbox (press Ctrl-T to show it) and then write statements to the Badboy log file:
If you want to indicate that something failed with Javascript, you can make an Assertion and add a "JScript Check" (from the Checks tab, which is usually next to the Tools tab). If you return false from the Check then it will get reported via the normal Badboy reporting mechanisms as an Assertion failure.
Trouble shooting
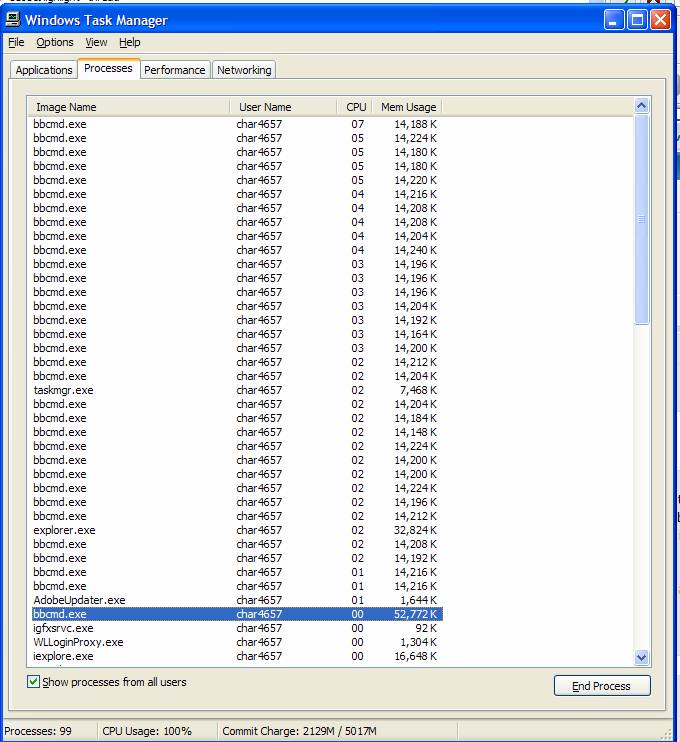
2. Stepping through your code:
You can right click on each request and choose Play and this will take you through your script one request at time.
Using Badboy 2.01 to Load Test ASP.Net Applications
These notes are for BadBoy 2.01. It is important to have the correct version. The author is continually updating Badboy. Many of the notes in the Badboy forum (http://www.badboy.com.au/forum/search.php ) refer to old versions of Badboy. Also there may be upcoming changes, particularly better Javascript handling.
The download point is here: http://www.badboy.com.au/